

TL;DR: Traditional Service Maps don’t work — so we built a better one.
Service Design maps are often:
- Overly long and hard to digest
- Difficult to navigate within the broader design process
- Treated more as research artifacts than as actionable client tools
- Rarely revisited, despite the huge effort that goes into creating them
- More about showcasing design thinking than driving real action
This project wasn’t just about summarizing insights from a complex customer platform we’d spent nearly a year developing. It was about creating a clearer, more interactive way to communicate those insights — helping our client truly understand and engage with what they’d invested in.
Project context:
JM sells catalysts — the essential components that enable chemical reactions to occur. Think of them as the “on” switch or the secret ingredient that helps manufacturers achieve maximum efficiency and yield in their industrial processes.
Purchasing a catalyst is a highly customised and complex journey. It involves significant financial, technical, and operational considerations, with the sales and development cycle typically spanning 1–2 years before the catalyst is installed and running in the factory.
rxn
Catalyst
Project Objectives
1
Research and Design of Digital companion Platform
Multiple rounds of user interviews and workshops took place to map out different user needs and platform considerations
2
Persona Generation and Service touch points mapping
Service mapping across different persona/role types
3
Aligning Service journey with product
Detailing the product touch points along the fleshed out digital companion platform.
What did we do?
The Digital Companion was designed as a customer portal to simplify the process of buying catalysts — enabling clients to manage the purchase, licensing, and ongoing maintenance of their factory-specific catalysts.
We set out to map this intricate, multi-year service journey to better understand and improve the customer experience end-to-end.
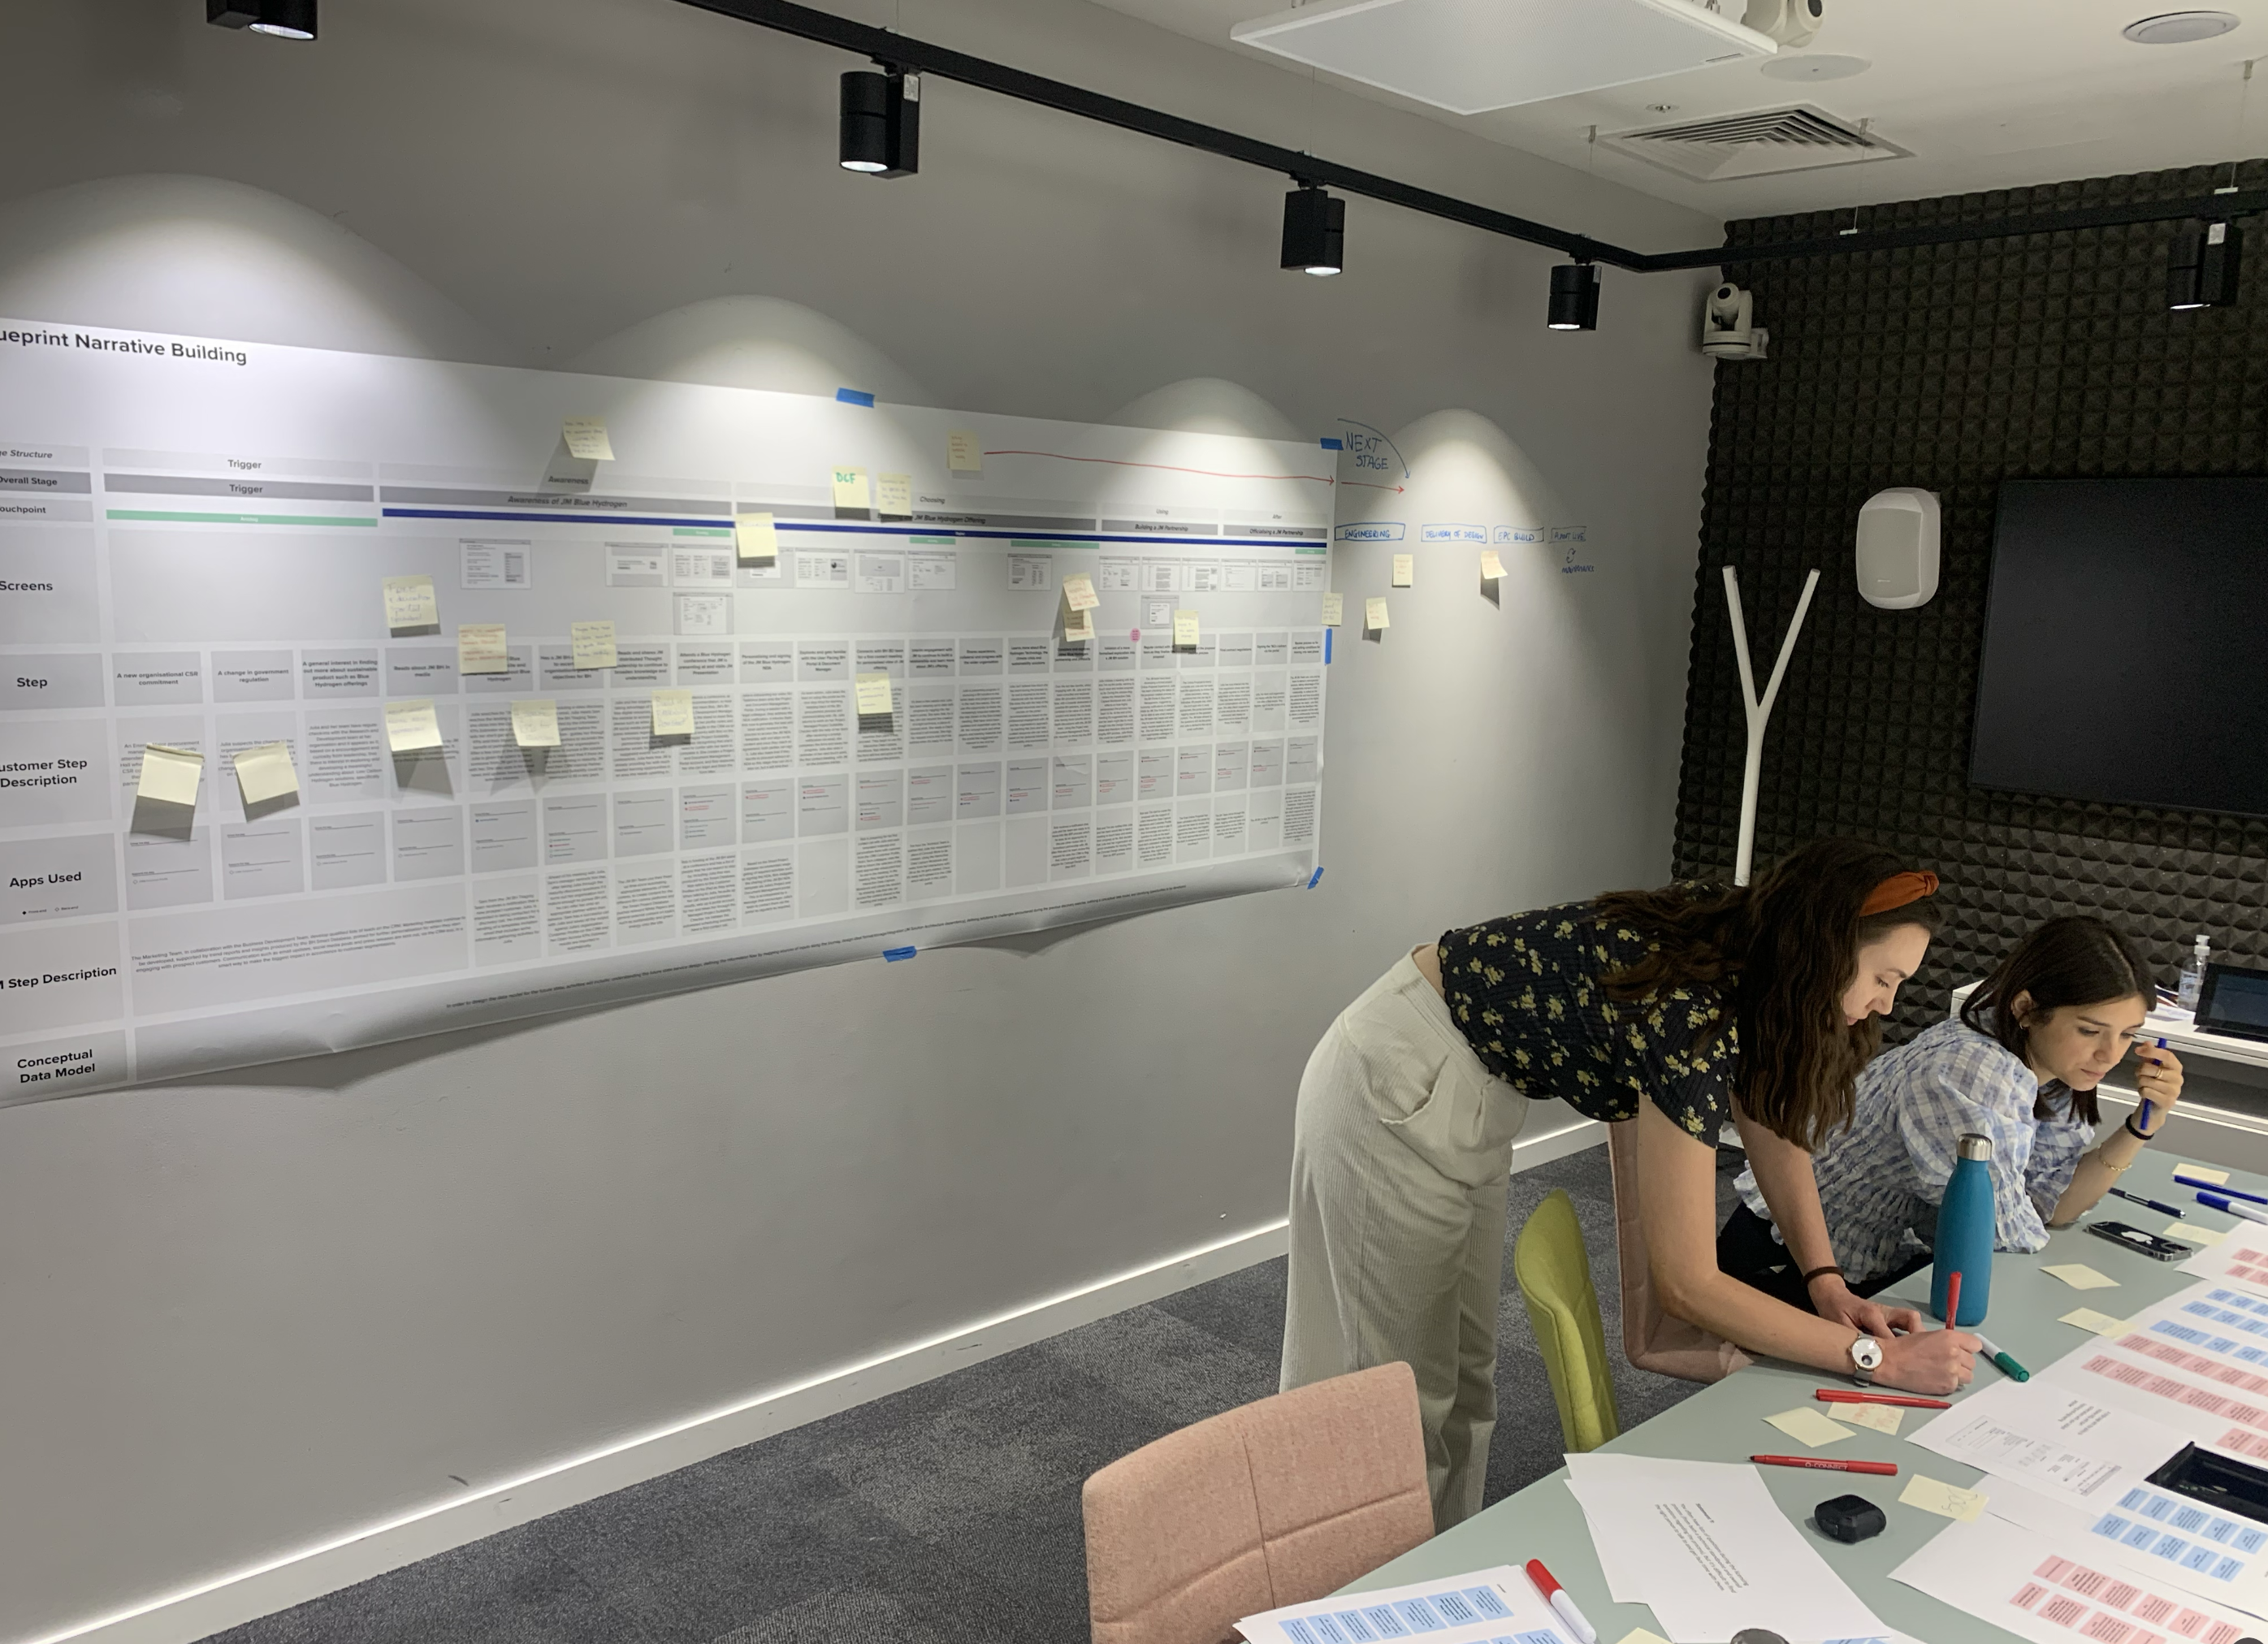

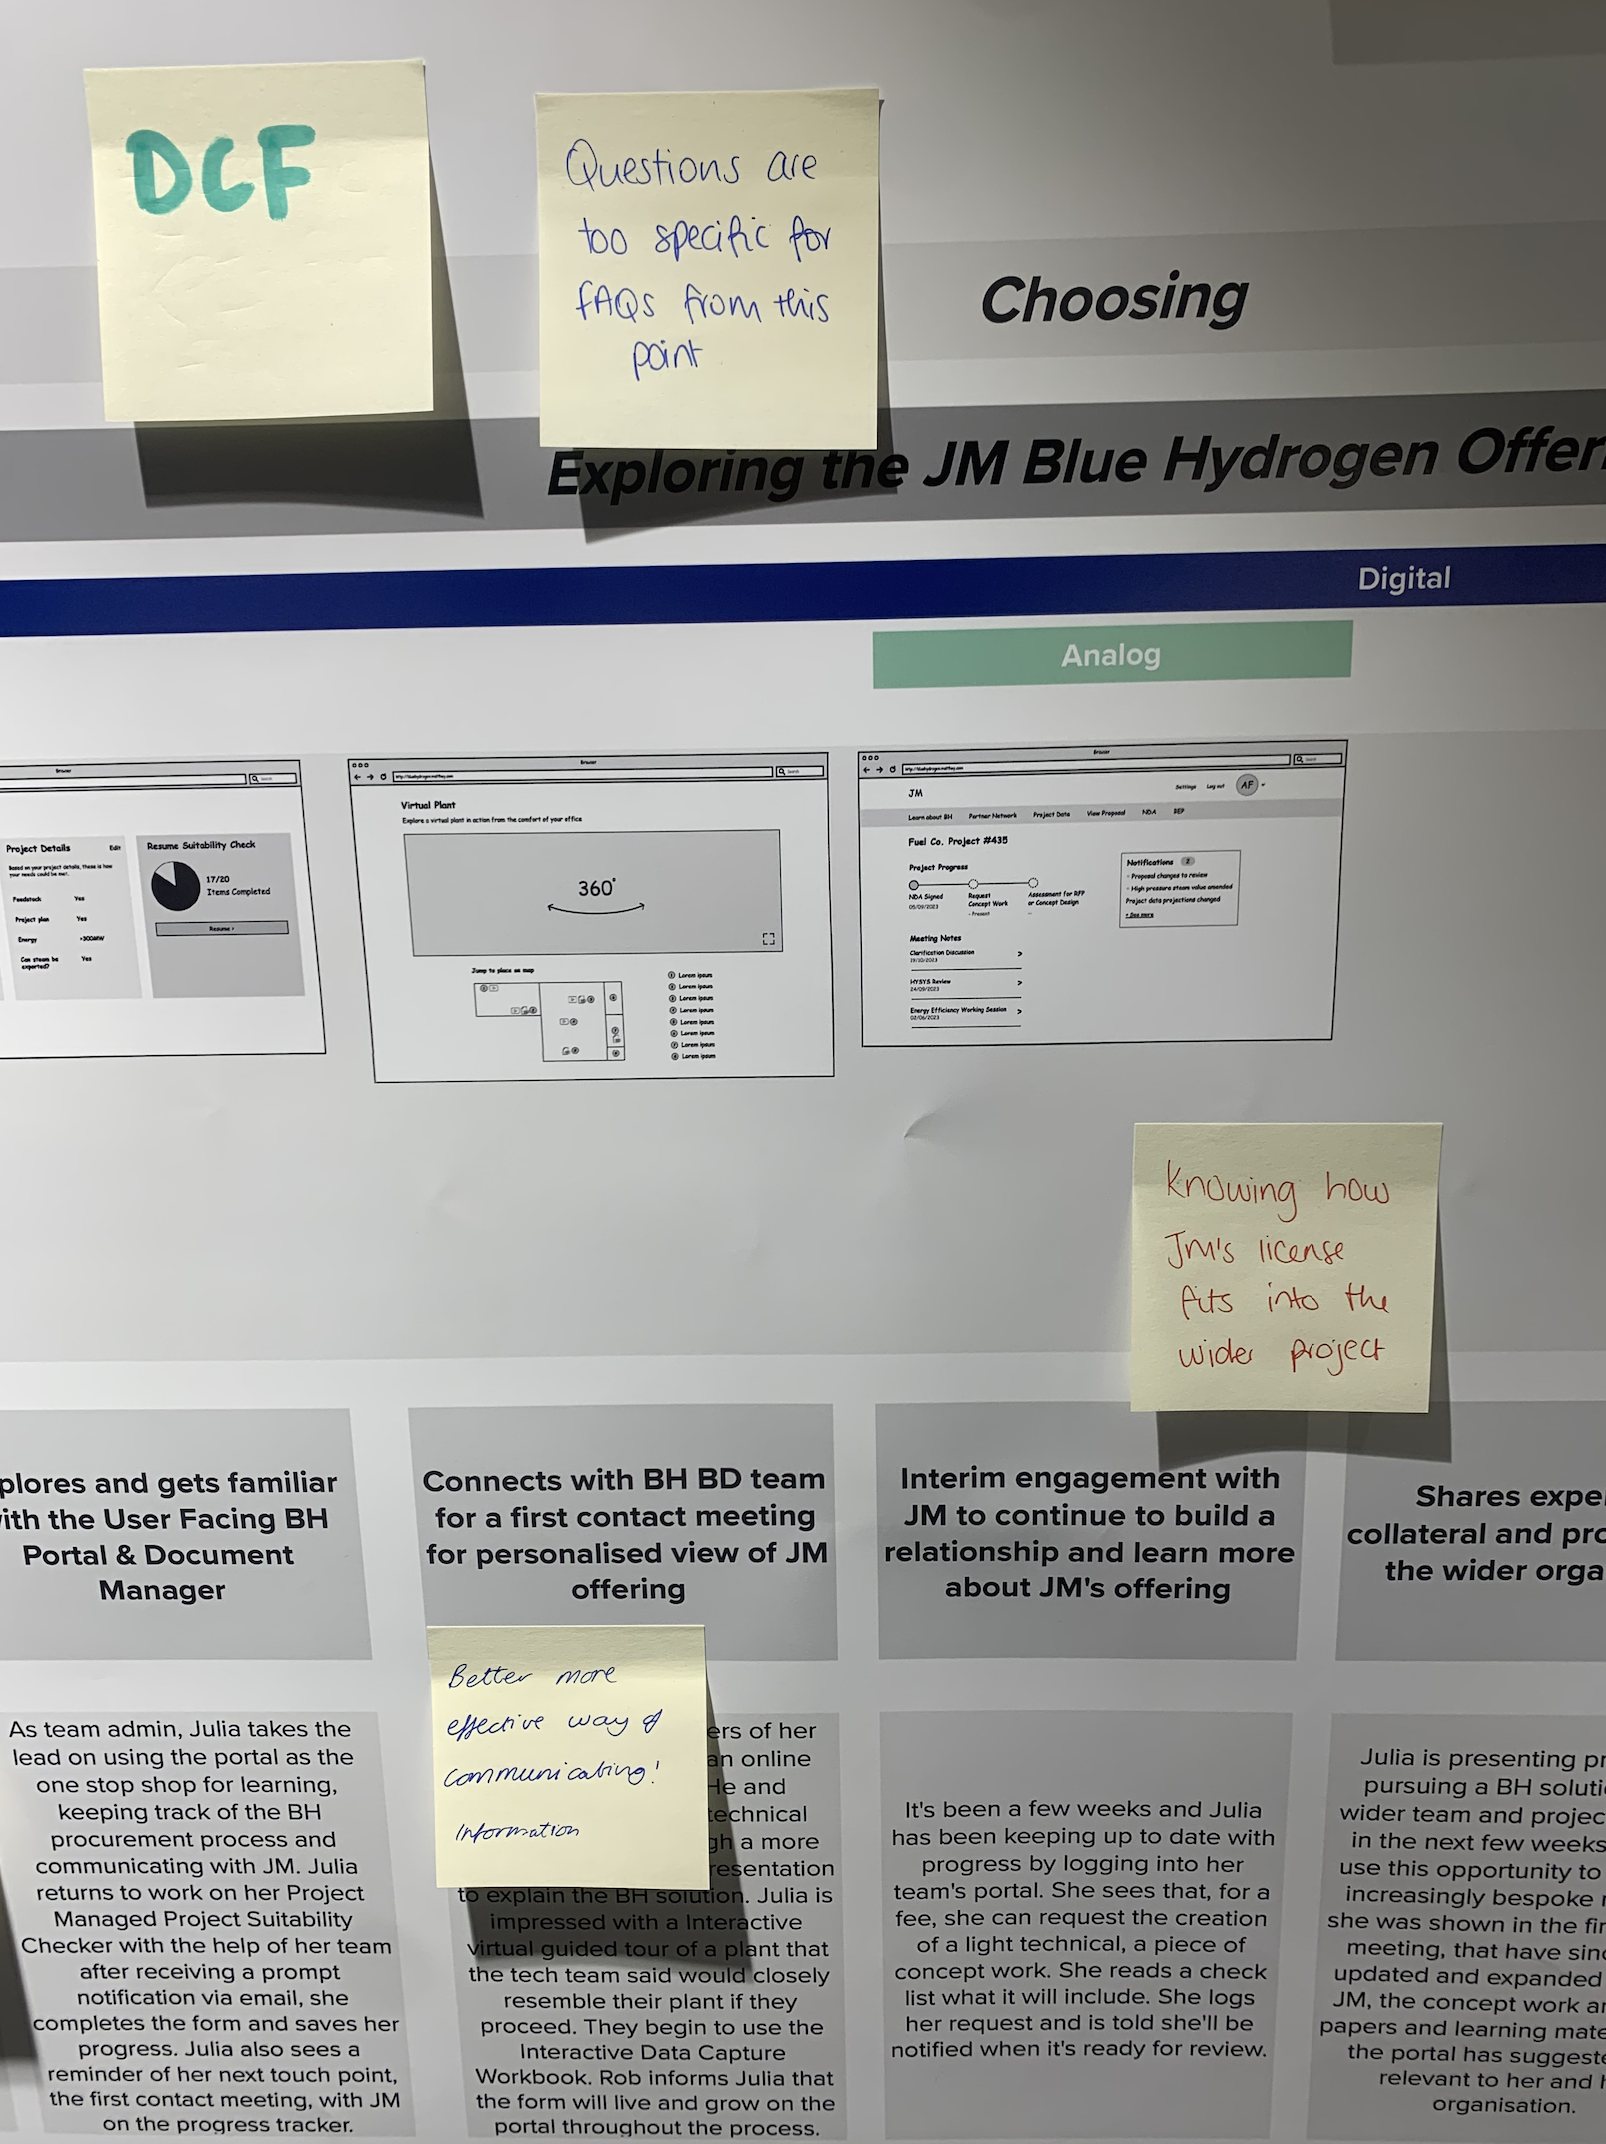


Visualising touch points
We mapped each archetype onto the service journey, calling out the tools, technologies, and strategies they used along the way.
This revealed how different users interacted with the platform, where their workflows overlapped, and where gaps or opportunities existed — creating a clear, actionable view of people, processes, and technology in one place.
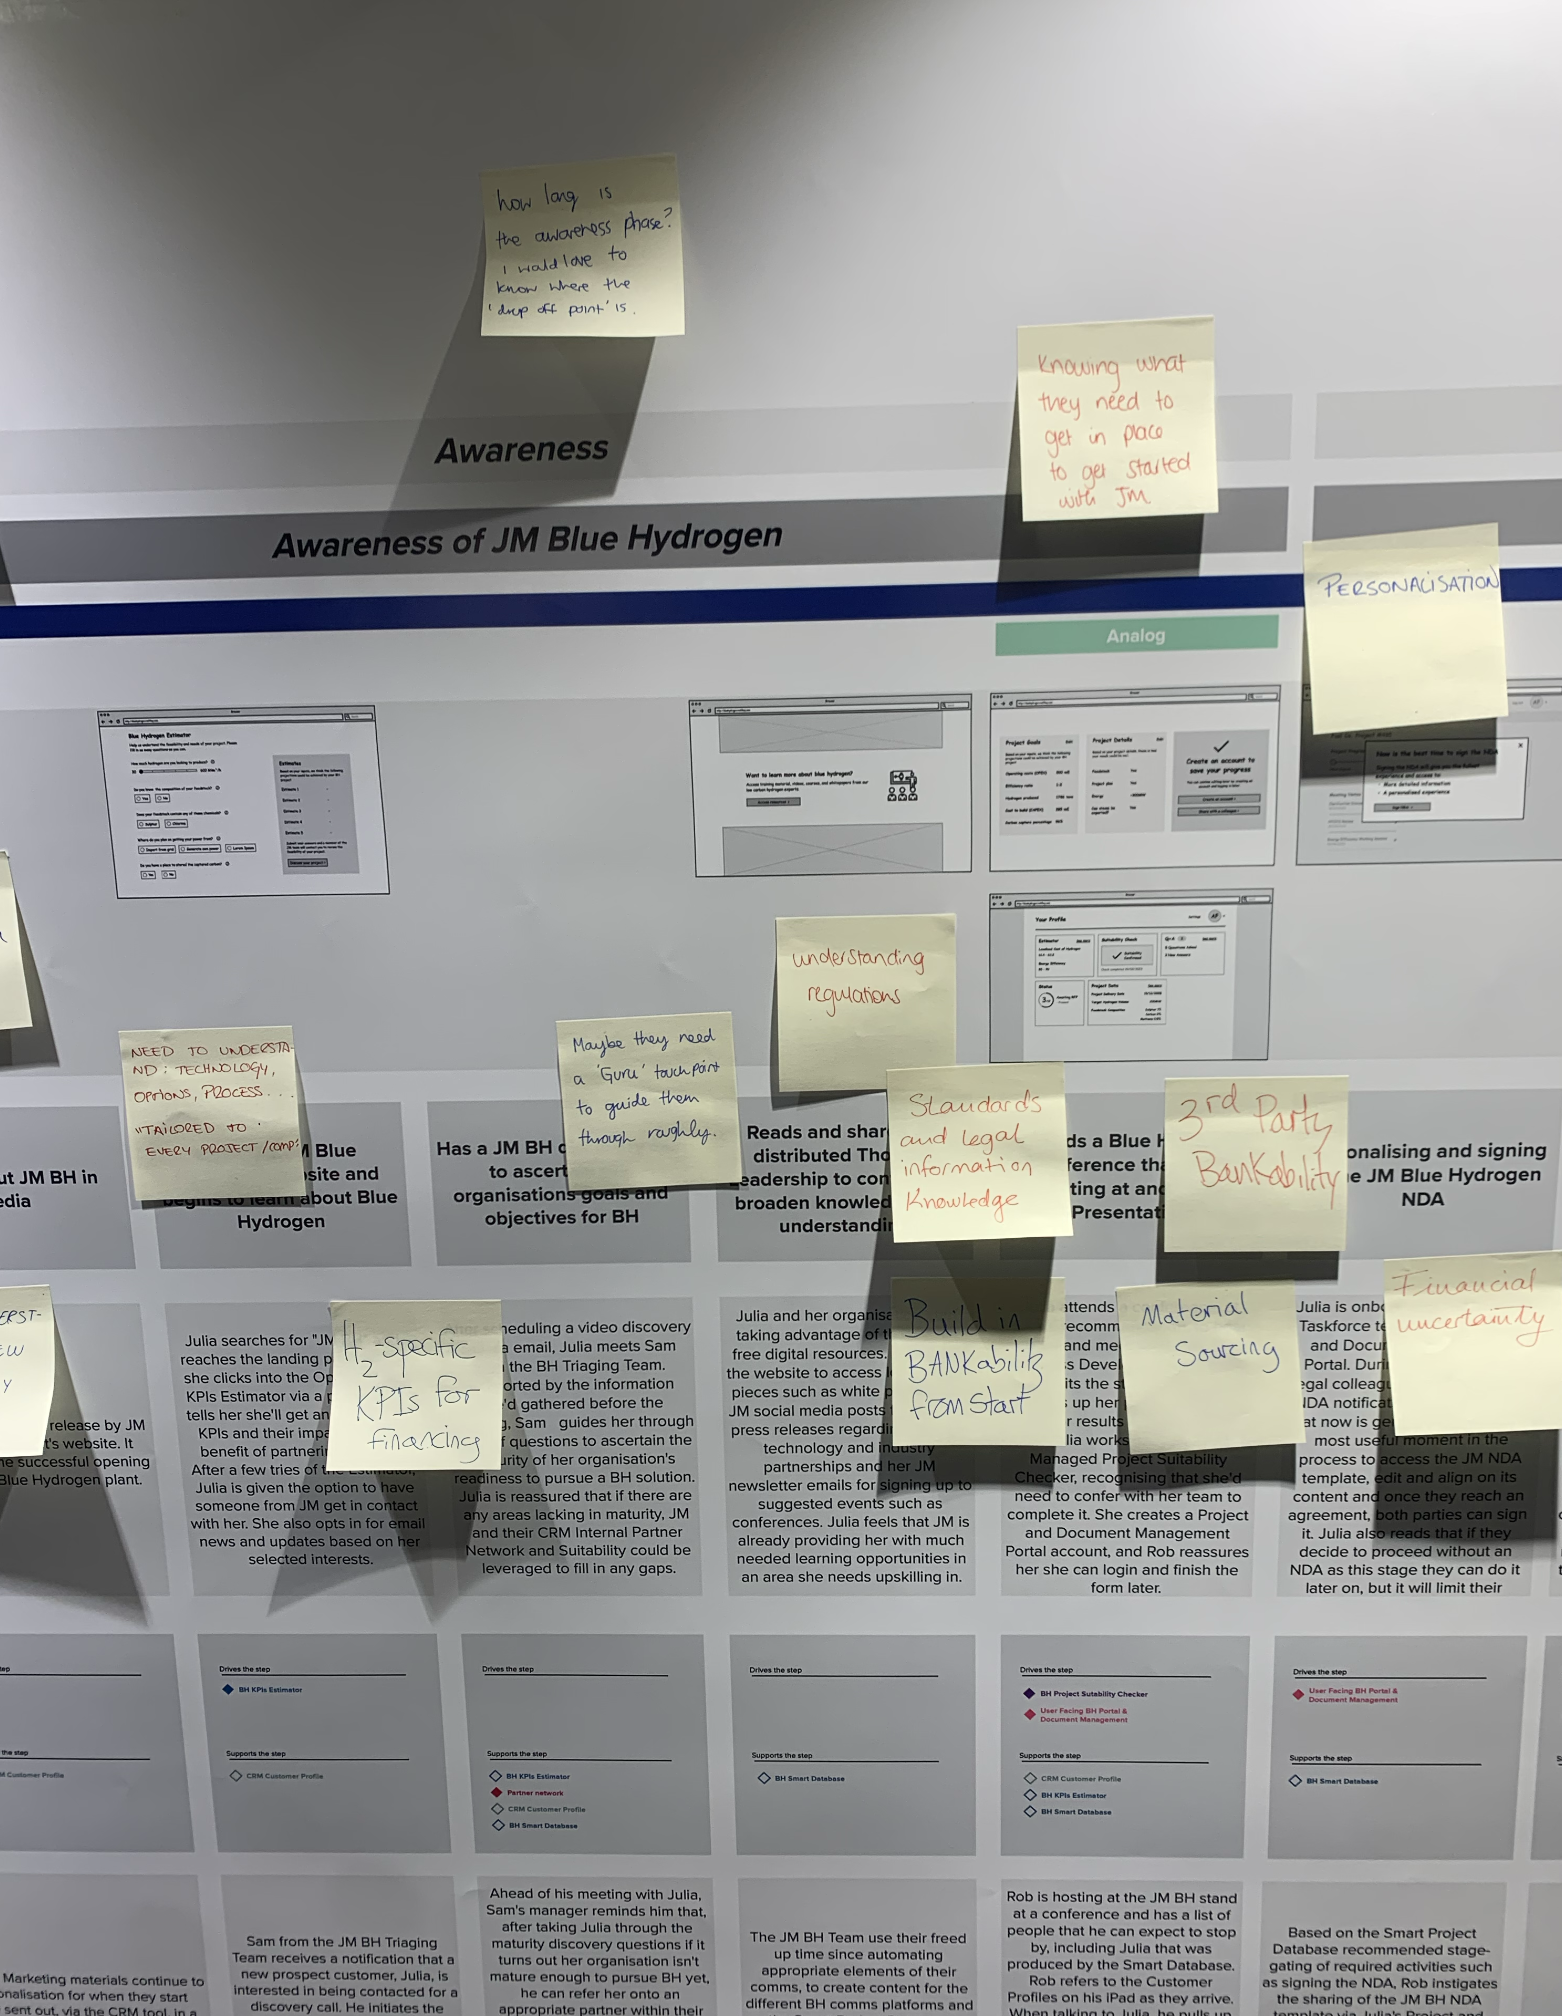
Archetypes and service touch points
We developed a set of user archetypes to capture the different types of people using the platform.
This helped illustrate how each user’s goals, behaviors, and interactions varied — and how their touchpoints within the service differed accordingly.
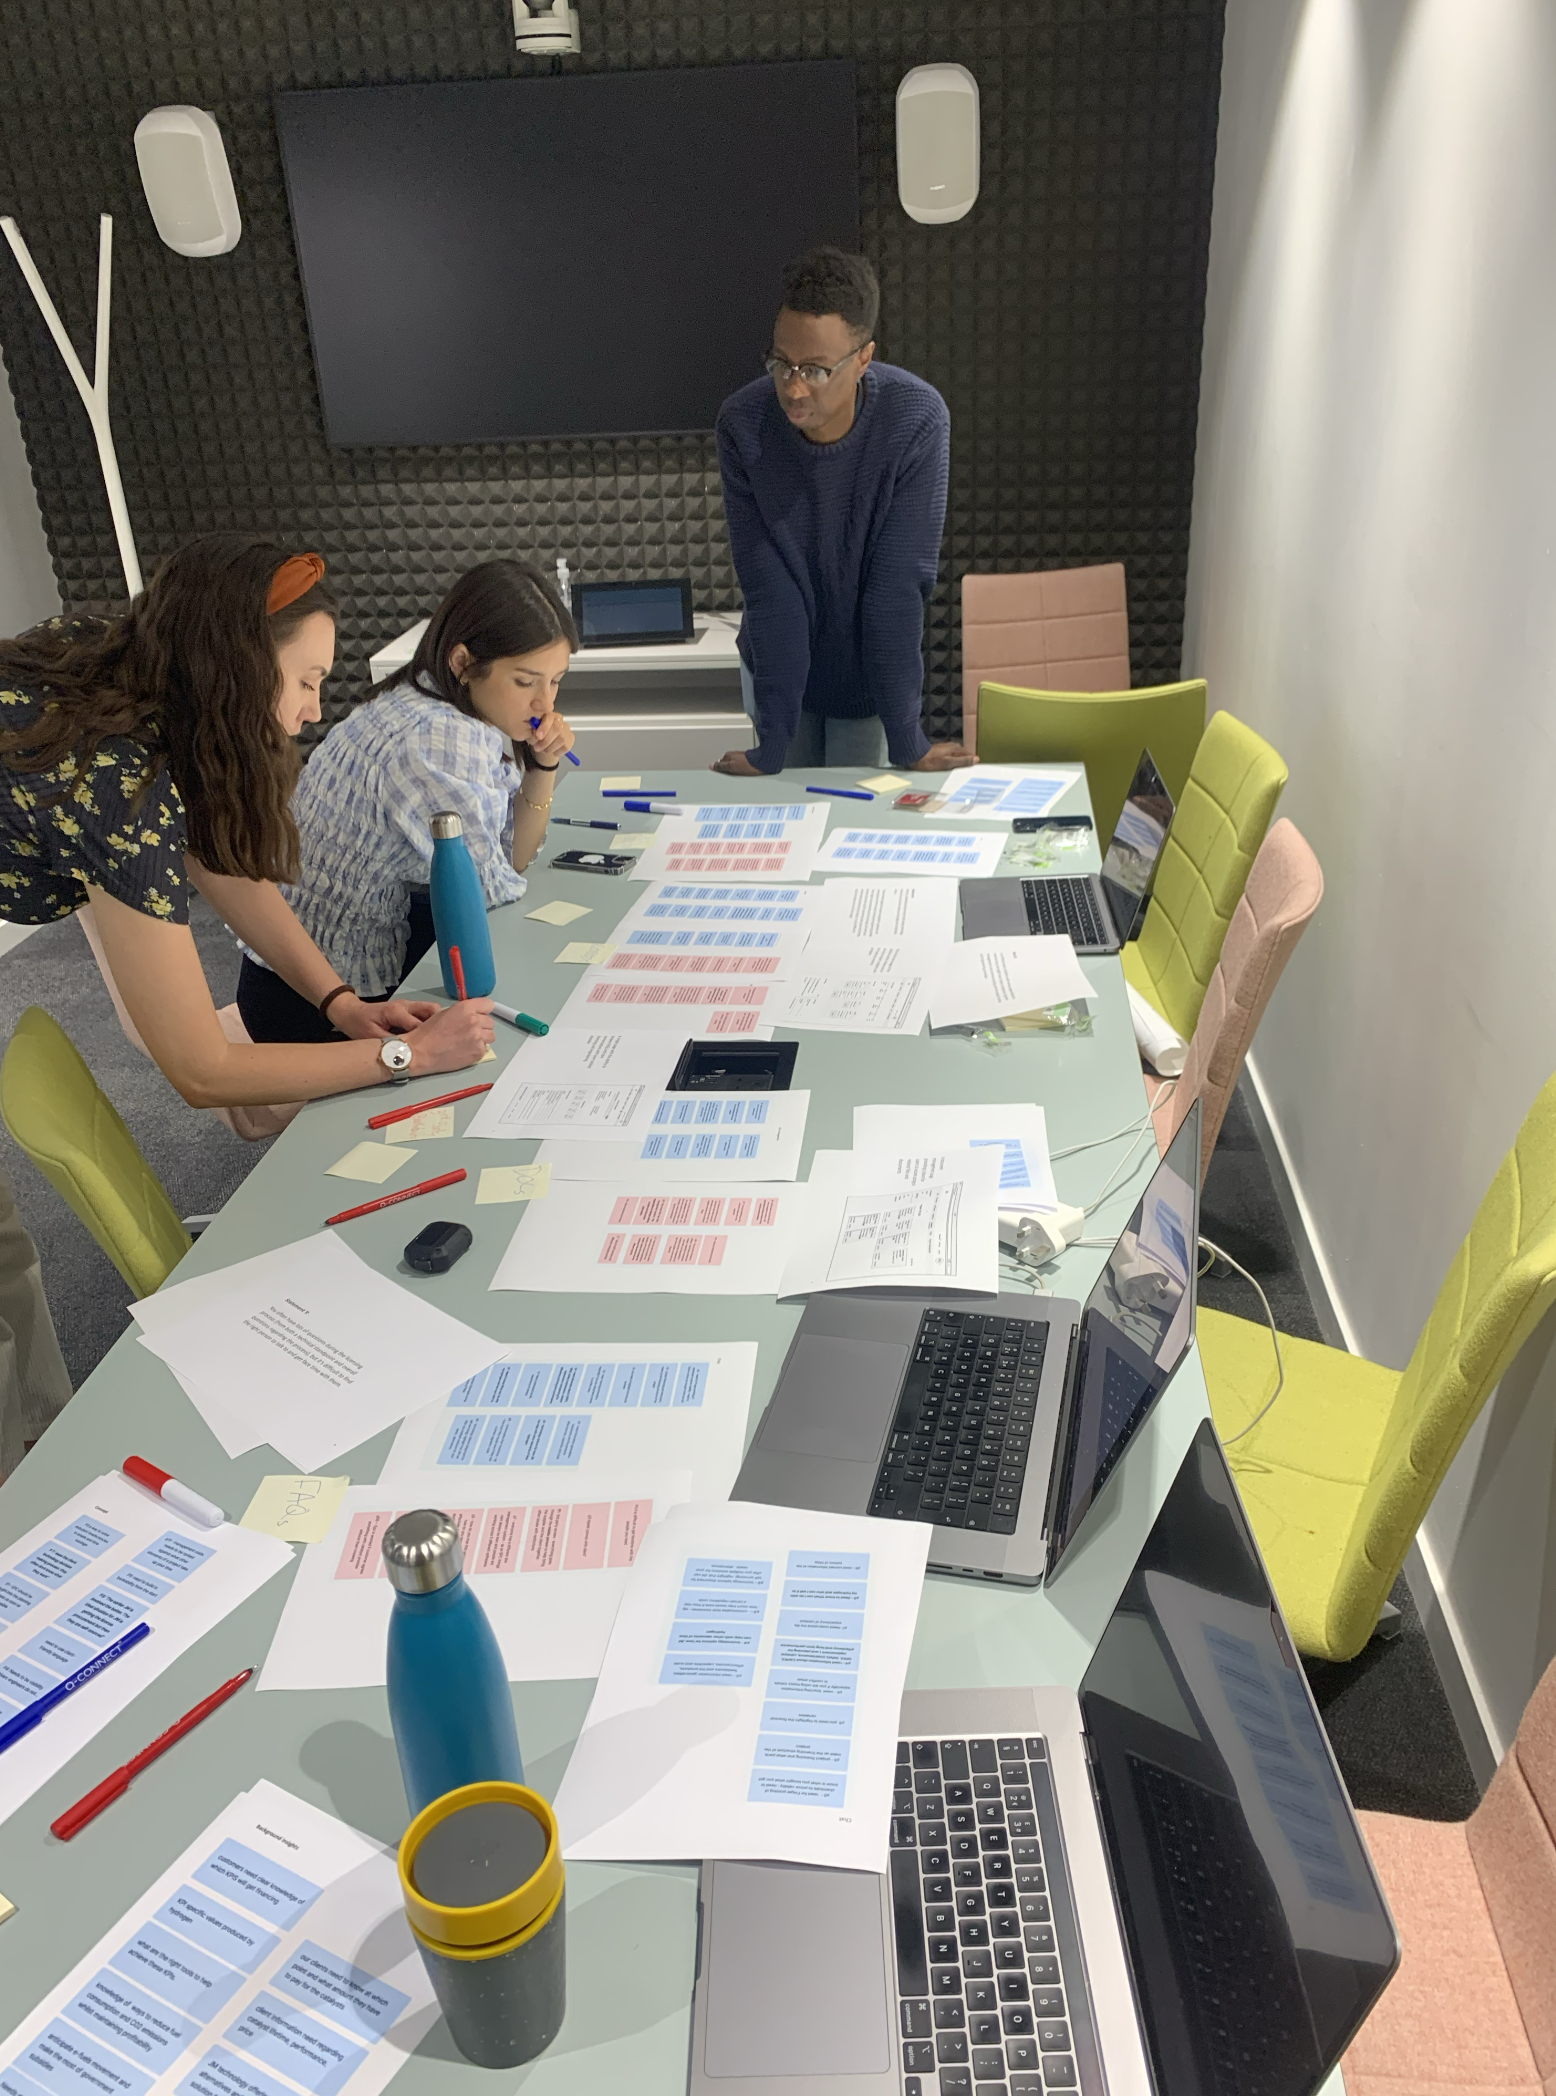
Rounds of User Research
We conducted multiple rounds of research with both JM employees and customers, using a range of methods including:
- Concept testing
- One-on-one interviews
- Collaborative workshops
- Usability testing
These sessions enabled us to map the end-to-end processes and iteratively develop the design of the Digital Companion, ensuring it was grounded in real user needs and business realities.
Aligning map with product
Most importantly, we wanted to connect the user research that informed the product directly back to the features and interactions it helped shape. We saw the service map as the glue that holds everything together — not the tangled web of sticky notes it so often becomes on a Miro board at the end of a project.
Also it was a nice way to demo a years worth of work.
Outputs
1
End to End Product Design
A validated digital platform design, delivering an intuitive and user-centred experience for managing catalyst purchases and licenses.
2
Comprehensive research landscape mapping
Delivered insights detailing user needs, pain points, and process considerations across two sided catalyst purchase process,
3
Connecting the broader ecosystem
A clear, interactive service map connecting research findings to real product use cases — demonstrating how different users engage with the platform.
Team Work
Service mapping work was owned by myself and Pearl Pulges.
TL;DR: Traditional Service Maps don’t work — so we built a better one.
Service Design maps are often:
- Overly long and hard to digest
- Difficult to navigate within the broader design process
- Treated more as research artifacts than as actionable client tools
- Rarely revisited, despite the huge effort that goes into creating them
- More about showcasing design thinking than driving real action
This project wasn’t just about summarizing insights from a complex customer platform we’d spent nearly a year developing. It was about creating a clearer, more interactive way to communicate those insights — helping our client truly understand and engage with what they’d invested in.
Project context:
JM sells catalysts — the essential components that enable chemical reactions to occur. Think of them as the “on” switch or the secret ingredient that helps manufacturers achieve maximum efficiency and yield in their industrial processes.
Purchasing a catalyst is a highly customised and complex journey. It involves significant financial, technical, and operational considerations, with the sales and development cycle typically spanning 1–2 years before the catalyst is installed and running in the factory.
rxn
Catalyst
Project Objectives
1
Research and Design of Digital companion Platform
Multiple rounds of user interviews and workshops took place to map out different user needs and platform considerations
2
Persona Generation and Service touch points mapping
Service mapping across different persona/role types
3
Aligning Service journey with product
Detailing the product touch points along the fleshed out digital companion platform.
What did we do?
The Digital Companion was designed as a customer portal to simplify the process of buying catalysts — enabling clients to manage the purchase, licensing, and ongoing maintenance of their factory-specific catalysts.
We set out to map this intricate, multi-year service journey to better understand and improve the customer experience end-to-end.
Visualising touch points
We mapped each archetype onto the service journey, calling out the tools, technologies, and strategies they used along the way.
This revealed how different users interacted with the platform, where their workflows overlapped, and where gaps or opportunities existed — creating a clear, actionable view of people, processes, and technology in one place.
Archetypes and service touch points
We developed a set of user archetypes to capture the different types of people using the platform.
This helped illustrate how each user’s goals, behaviors, and interactions varied — and how their touchpoints within the service differed accordingly.
Rounds of User Research
We conducted multiple rounds of research with both JM employees and customers, using a range of methods including:
- Concept testing
- One-on-one interviews
- Collaborative workshops
- Usability testing
These sessions enabled us to map the end-to-end processes and iteratively develop the design of the Digital Companion, ensuring it was grounded in real user needs and business realities.
Aligning map with product
Most importantly, we wanted to connect the user research that informed the product directly back to the features and interactions it helped shape. We saw the service map as the glue that holds everything together — not the tangled web of sticky notes it so often becomes on a Miro board at the end of a project.
Also it was a nice way to demo a years worth of work.
Outputs
1
End to End Product Design
A validated digital platform design, delivering an intuitive and user-centred experience for managing catalyst purchases and licenses.
2
Comprehensive research landscape mapping
Delivered insights detailing user needs, pain points, and process considerations across two sided catalyst purchase process,
3
Connecting the broader ecosystem
A clear, interactive service map connecting research findings to real product use cases — demonstrating how different users engage with the platform.
Team Work
Service mapping work was owned by myself and Pearl Pulges.